Context
Test results arrive as tables of numbers and Latin terms. Treatment plans live in a doctor's head or on paper. A person's history is spread across clinics, years, and apps. The client, My Data, was building a next-generation medical record that pulls lab results, doctors' notes, wearable data, symptoms, and family history into one place. Their brief asked for seven sections: patient profile, doctor profile, data analysis, storage, clinics and doctors, telemedicine, and medication. A schedule and a body visualisation were optional. I designed all nine. The question I worked from: how might we help someone understand their own health without a medical degree? Same data, two very different jobs. A patient reads at home in the evening, with time to spare, wanting to know which way their health is going and what to do about it. A doctor reads during the appointment, with about a minute to scan the whole patient before deciding anything. That tension shaped the whole concept.
Challenge
I ran about 20 interviews with doctors and patients about what they would want from a digital medical record. Access and clarity came first: 81% wanted test results without visiting the clinic, 76% wanted a transparent, clear treatment plan, 73% wanted to avoid unnecessary tests and appointments, 63% wanted a second opinion at any time, and 58% wanted to know their treatment and vaccination history. Only 18% mentioned prevention and early diagnosis. I took that as an opportunity rather than a reason to drop it: people don't ask for prevention, so the product needed to build it into the daily view instead of hiding it in a separate feature. The brief itself read like everyone's wishlist in one pile at first. Once I regrouped it, much of it was already covered by what patients had actually asked for, and the real work was choosing what to cut: a full anamnesis collapsed into a dated summary with the full history one zoom level deeper, for the doctor. Wearable charts folded into the overall analysis instead of sitting as separate graphs nobody reads. Scans stored as files for the doctor, with a plain description and one key image for the patient. Two-way calendar sync became a simple Upcoming events list, since real sync needs heavy back-end work. And every recommendation got tied to a reason, steps to heart health, diet to cholesterol, since advice without a why gets ignored.
Solution
Stage I set the concept and visual style across 12 days: research, user flow, wireframes, UI, and a style guide that grew alongside the screens. Between stages the client shared feedback and their own survey data, and I used it to correct the concept, rebuilding the patient side over 10 days and designing a doctor side from scratch in 3. What came out of it is five principles, each with its own home screen, each one answering a specific finding from the interviews rather than a generic dashboard instinct. A sixth screen, for the doctor, takes the same data and compresses it for a one-minute scan instead of an evening read.
Personalised: Today
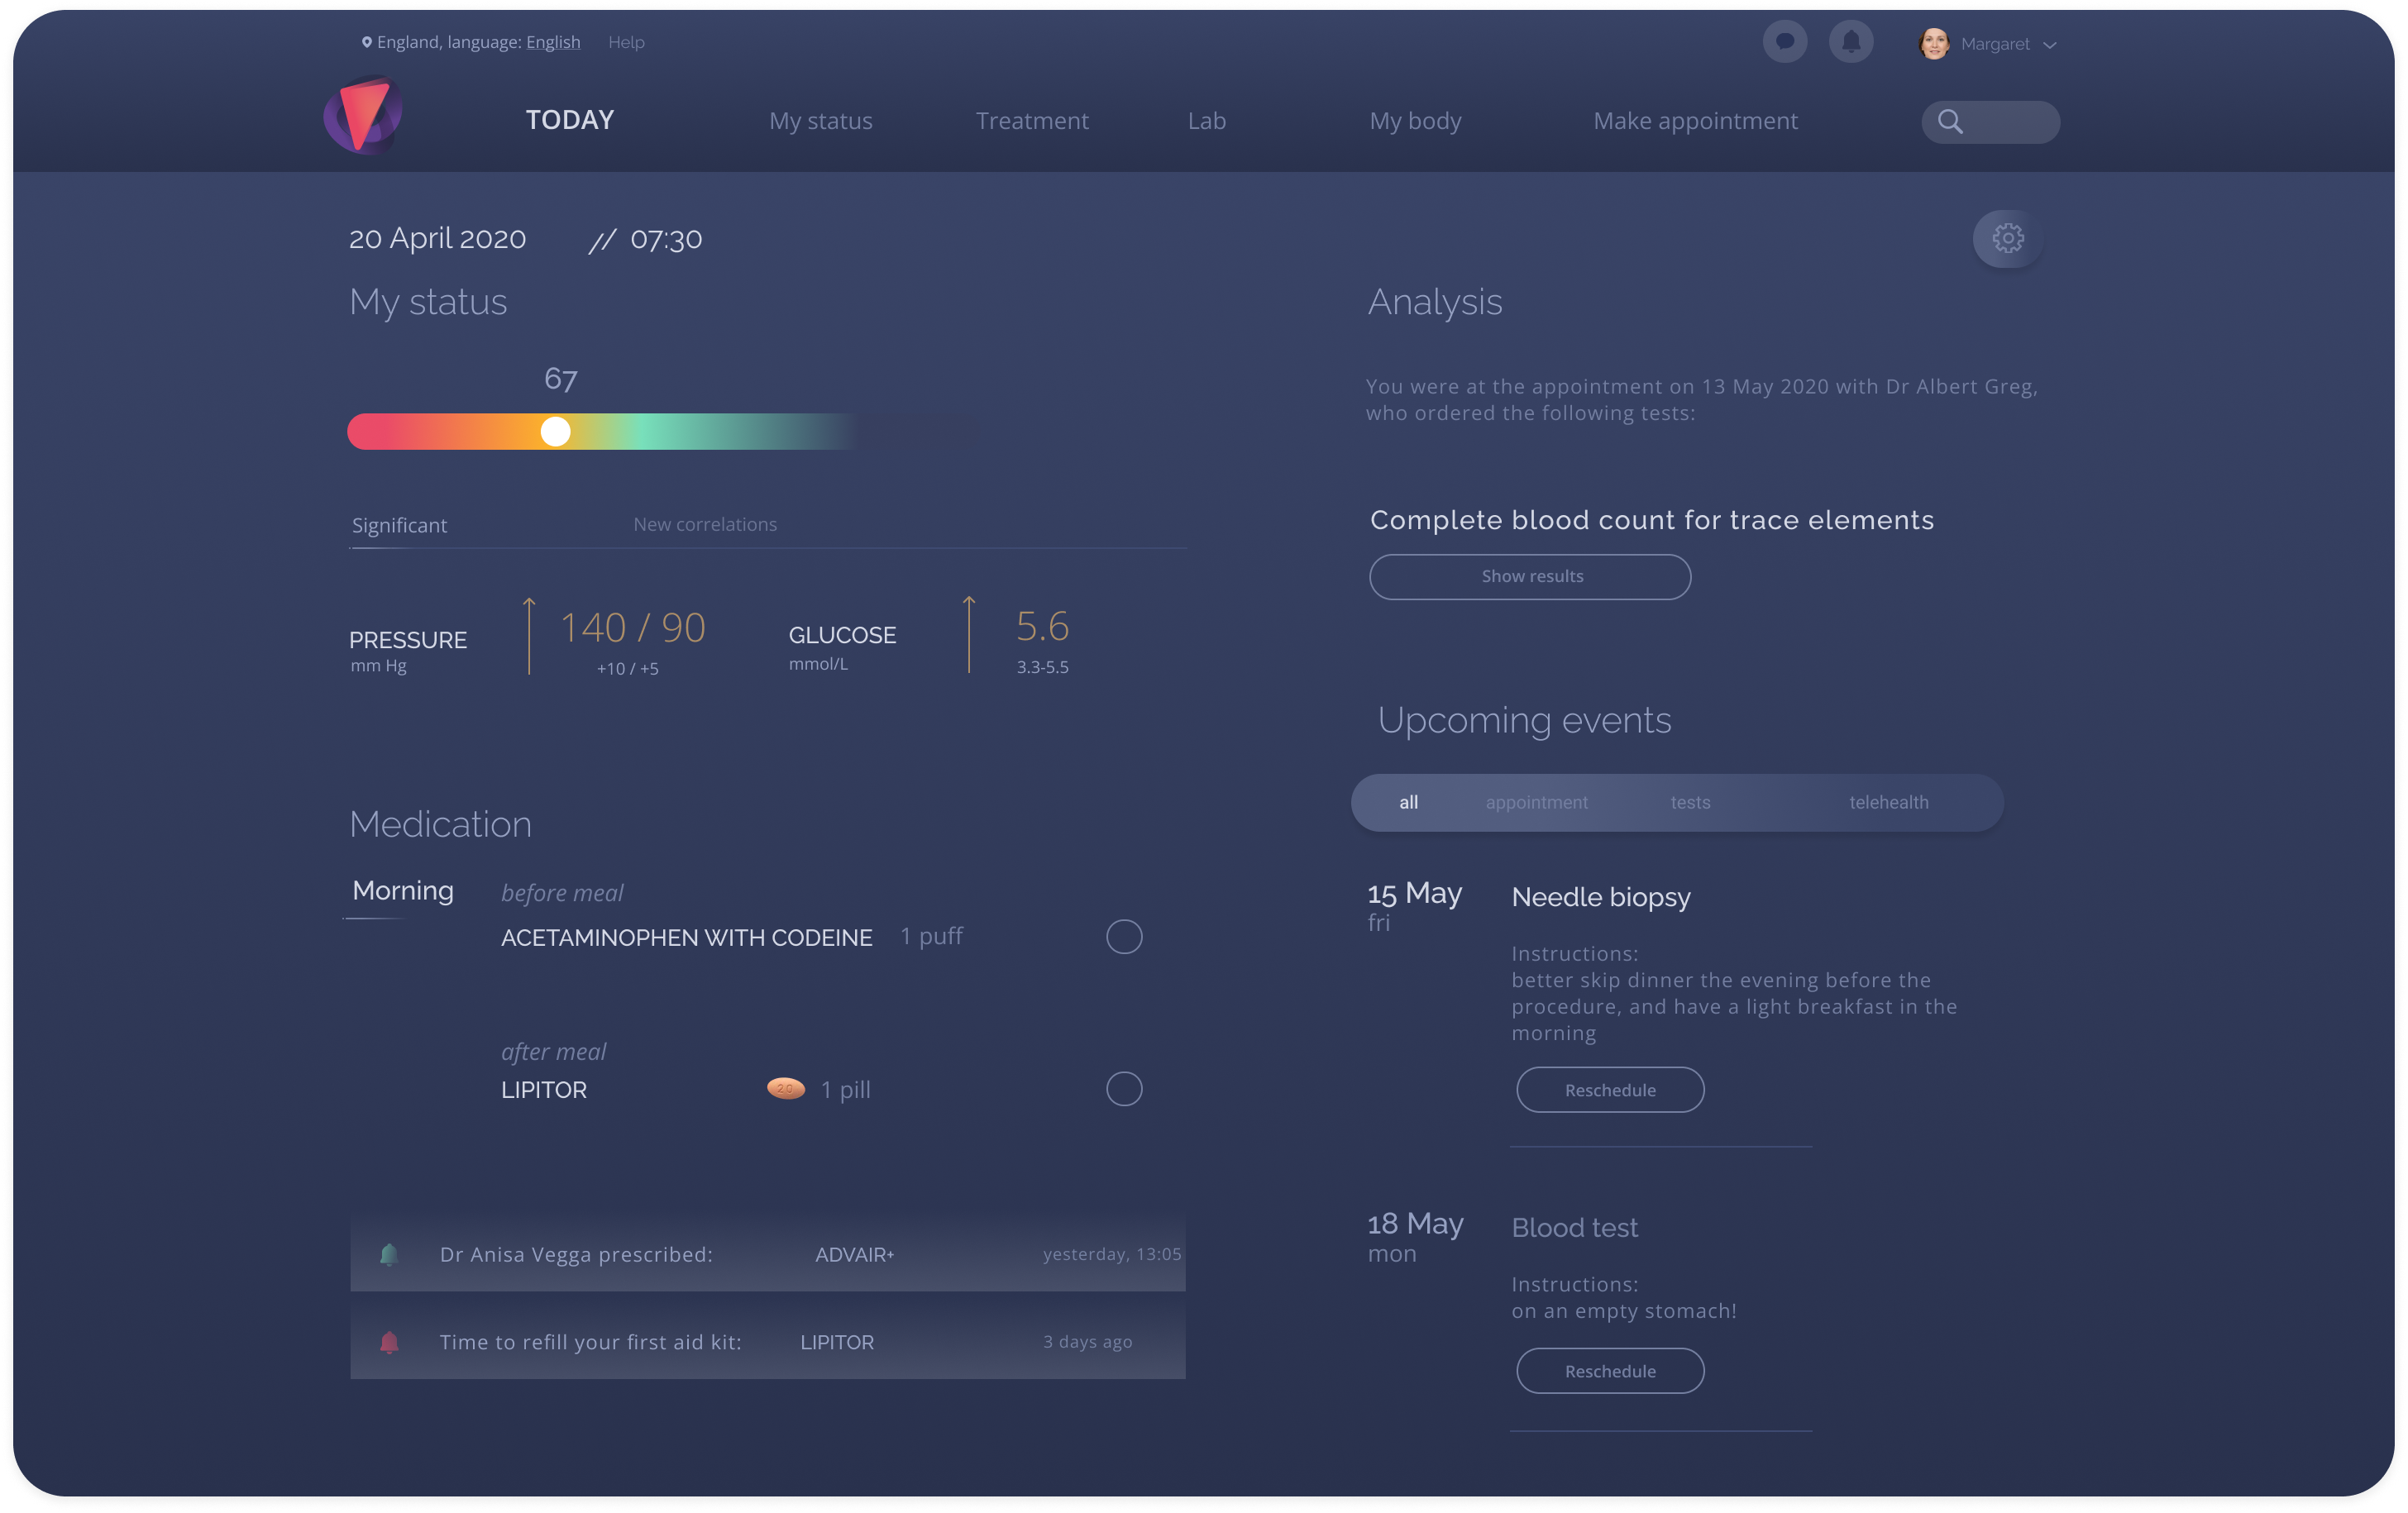
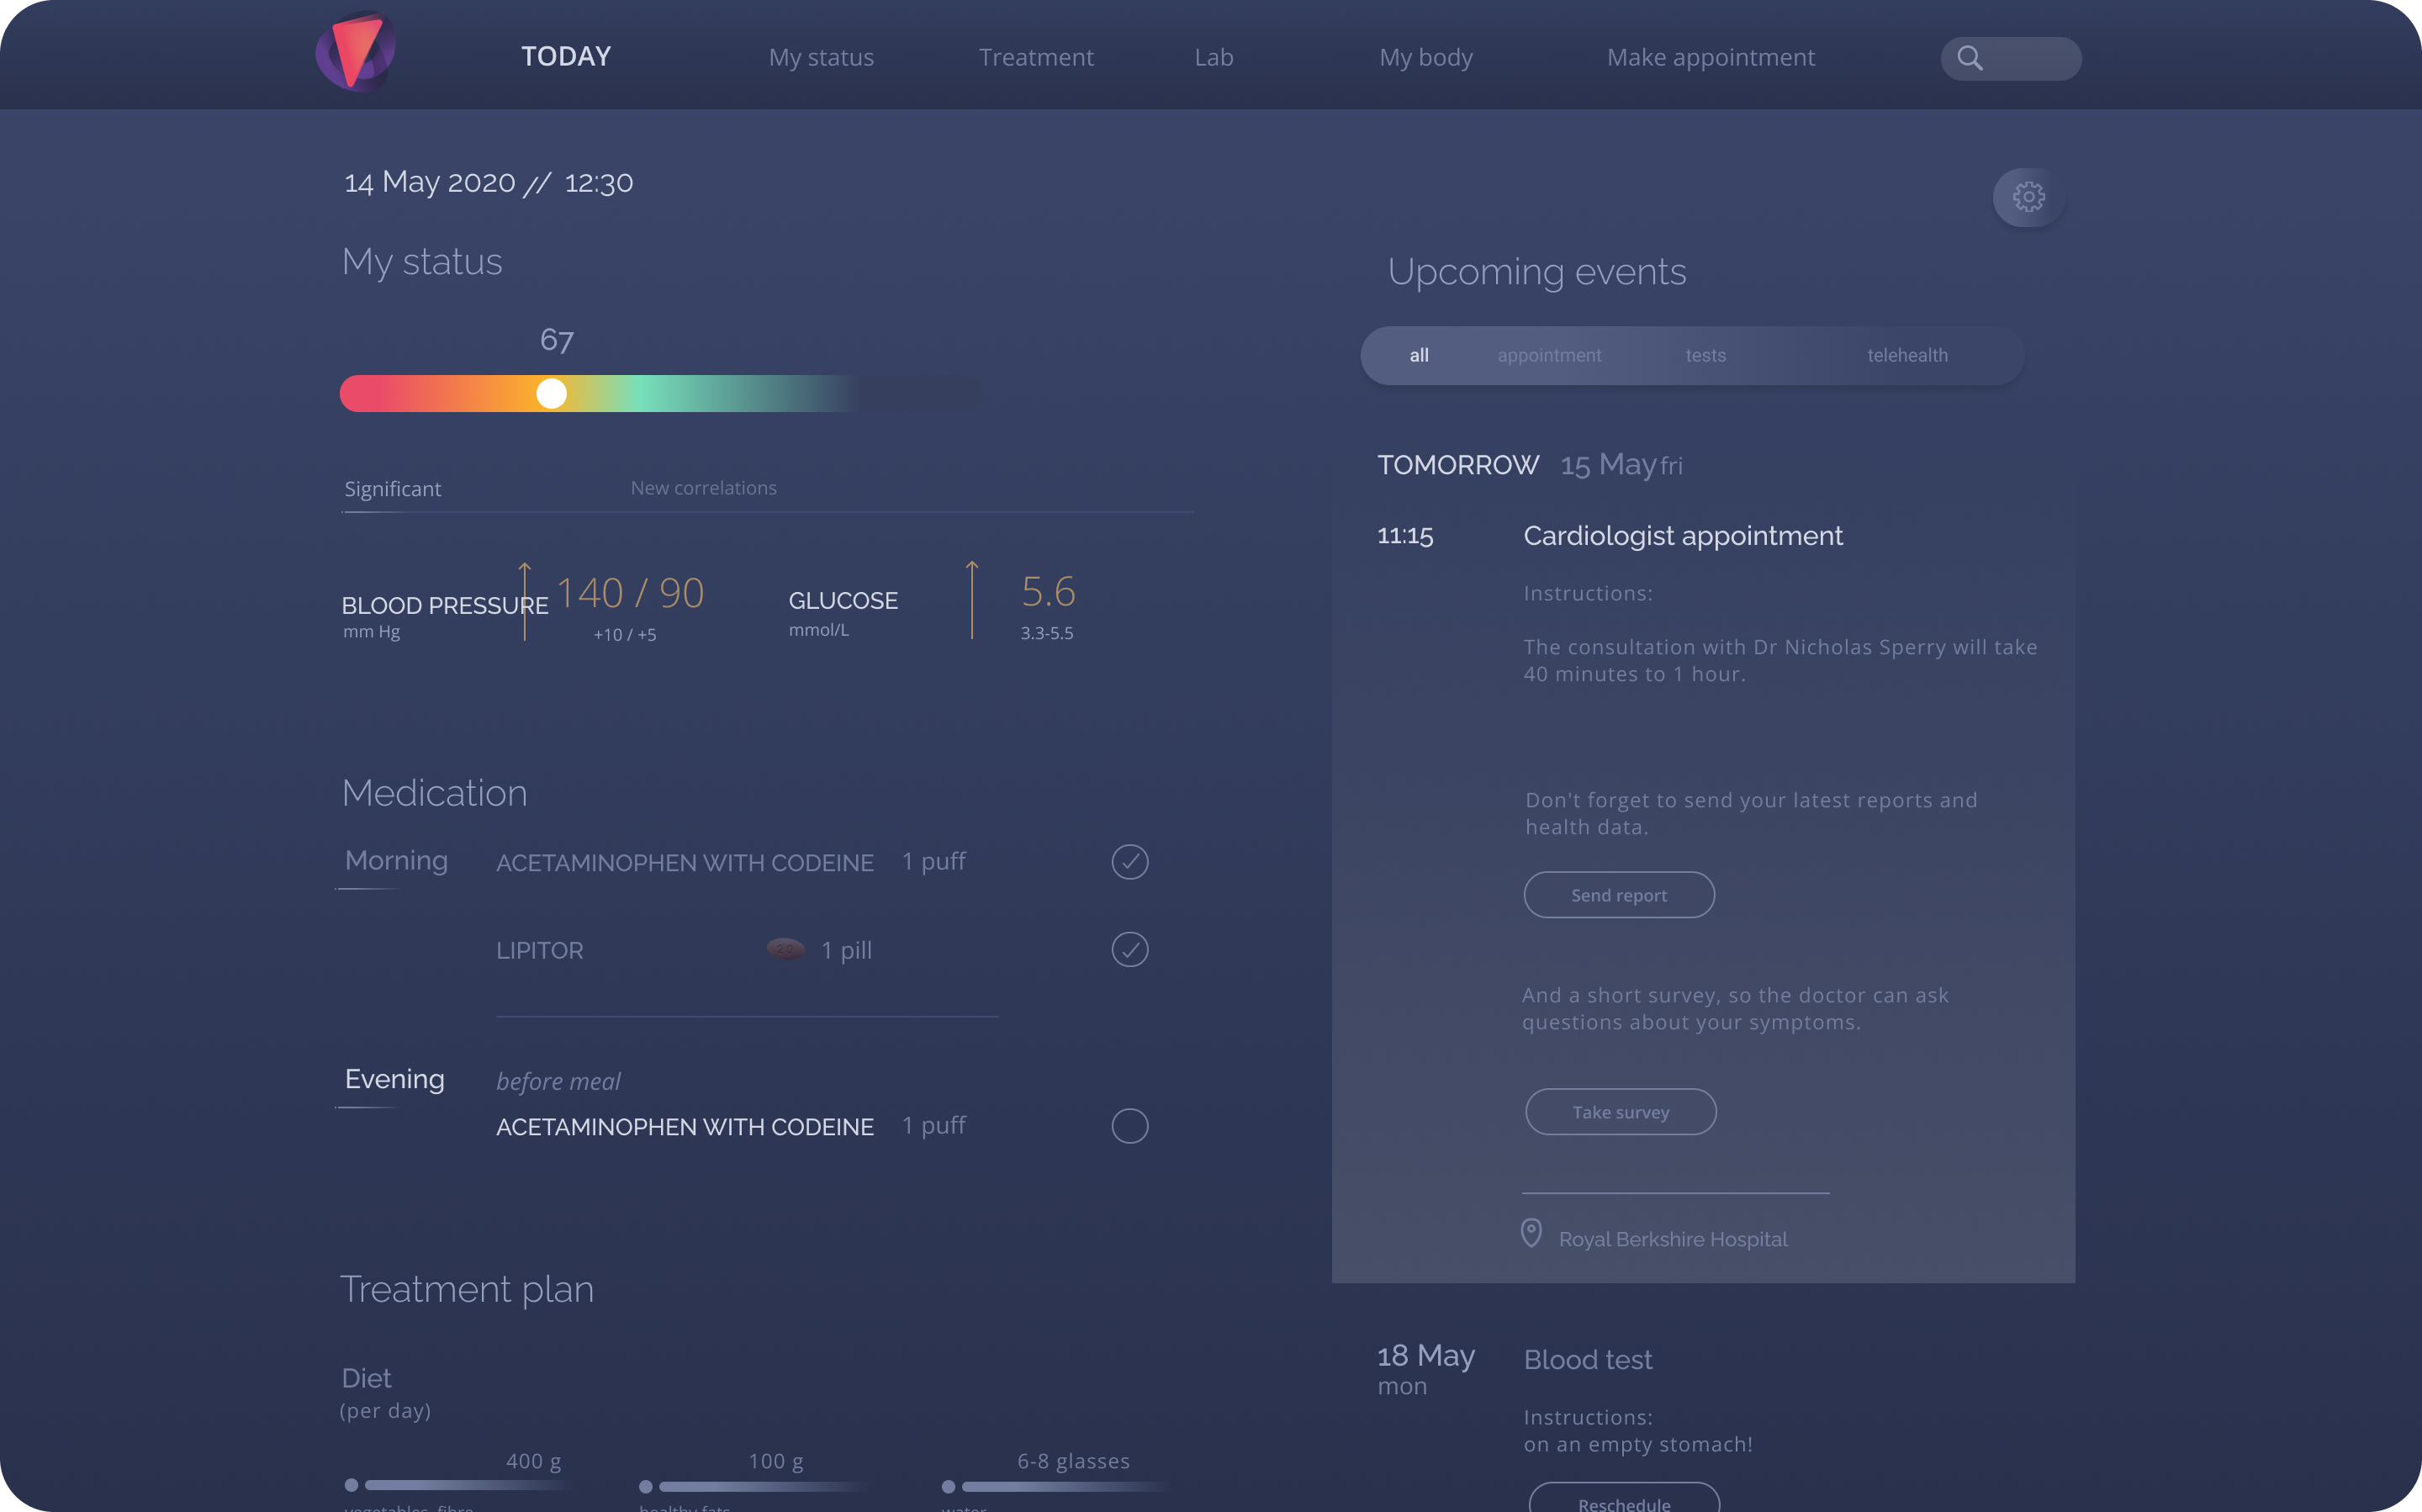
Today is where a patient's day starts: the health score, two key vitals against their normal range, pills to tick off before and after meals, doctor messages, upcoming tests with preparation instructions, and the day's diet and fitness targets, all in one place before anything else gets opened. It is the clearest answer the product gives to the research's single biggest ask: 76% wanted a transparent, clear treatment plan.
One page, built from self-contained modules
Each block on Today, score, vitals, medication, messages, tests, targets, is its own self-contained module rather than a single fixed layout. That was a deliberate constraint: the brief's smartwatch scenario meant any module had to be able to move to a smaller screen on its own, without the rest of the page coming with it.
Dynamic: My status
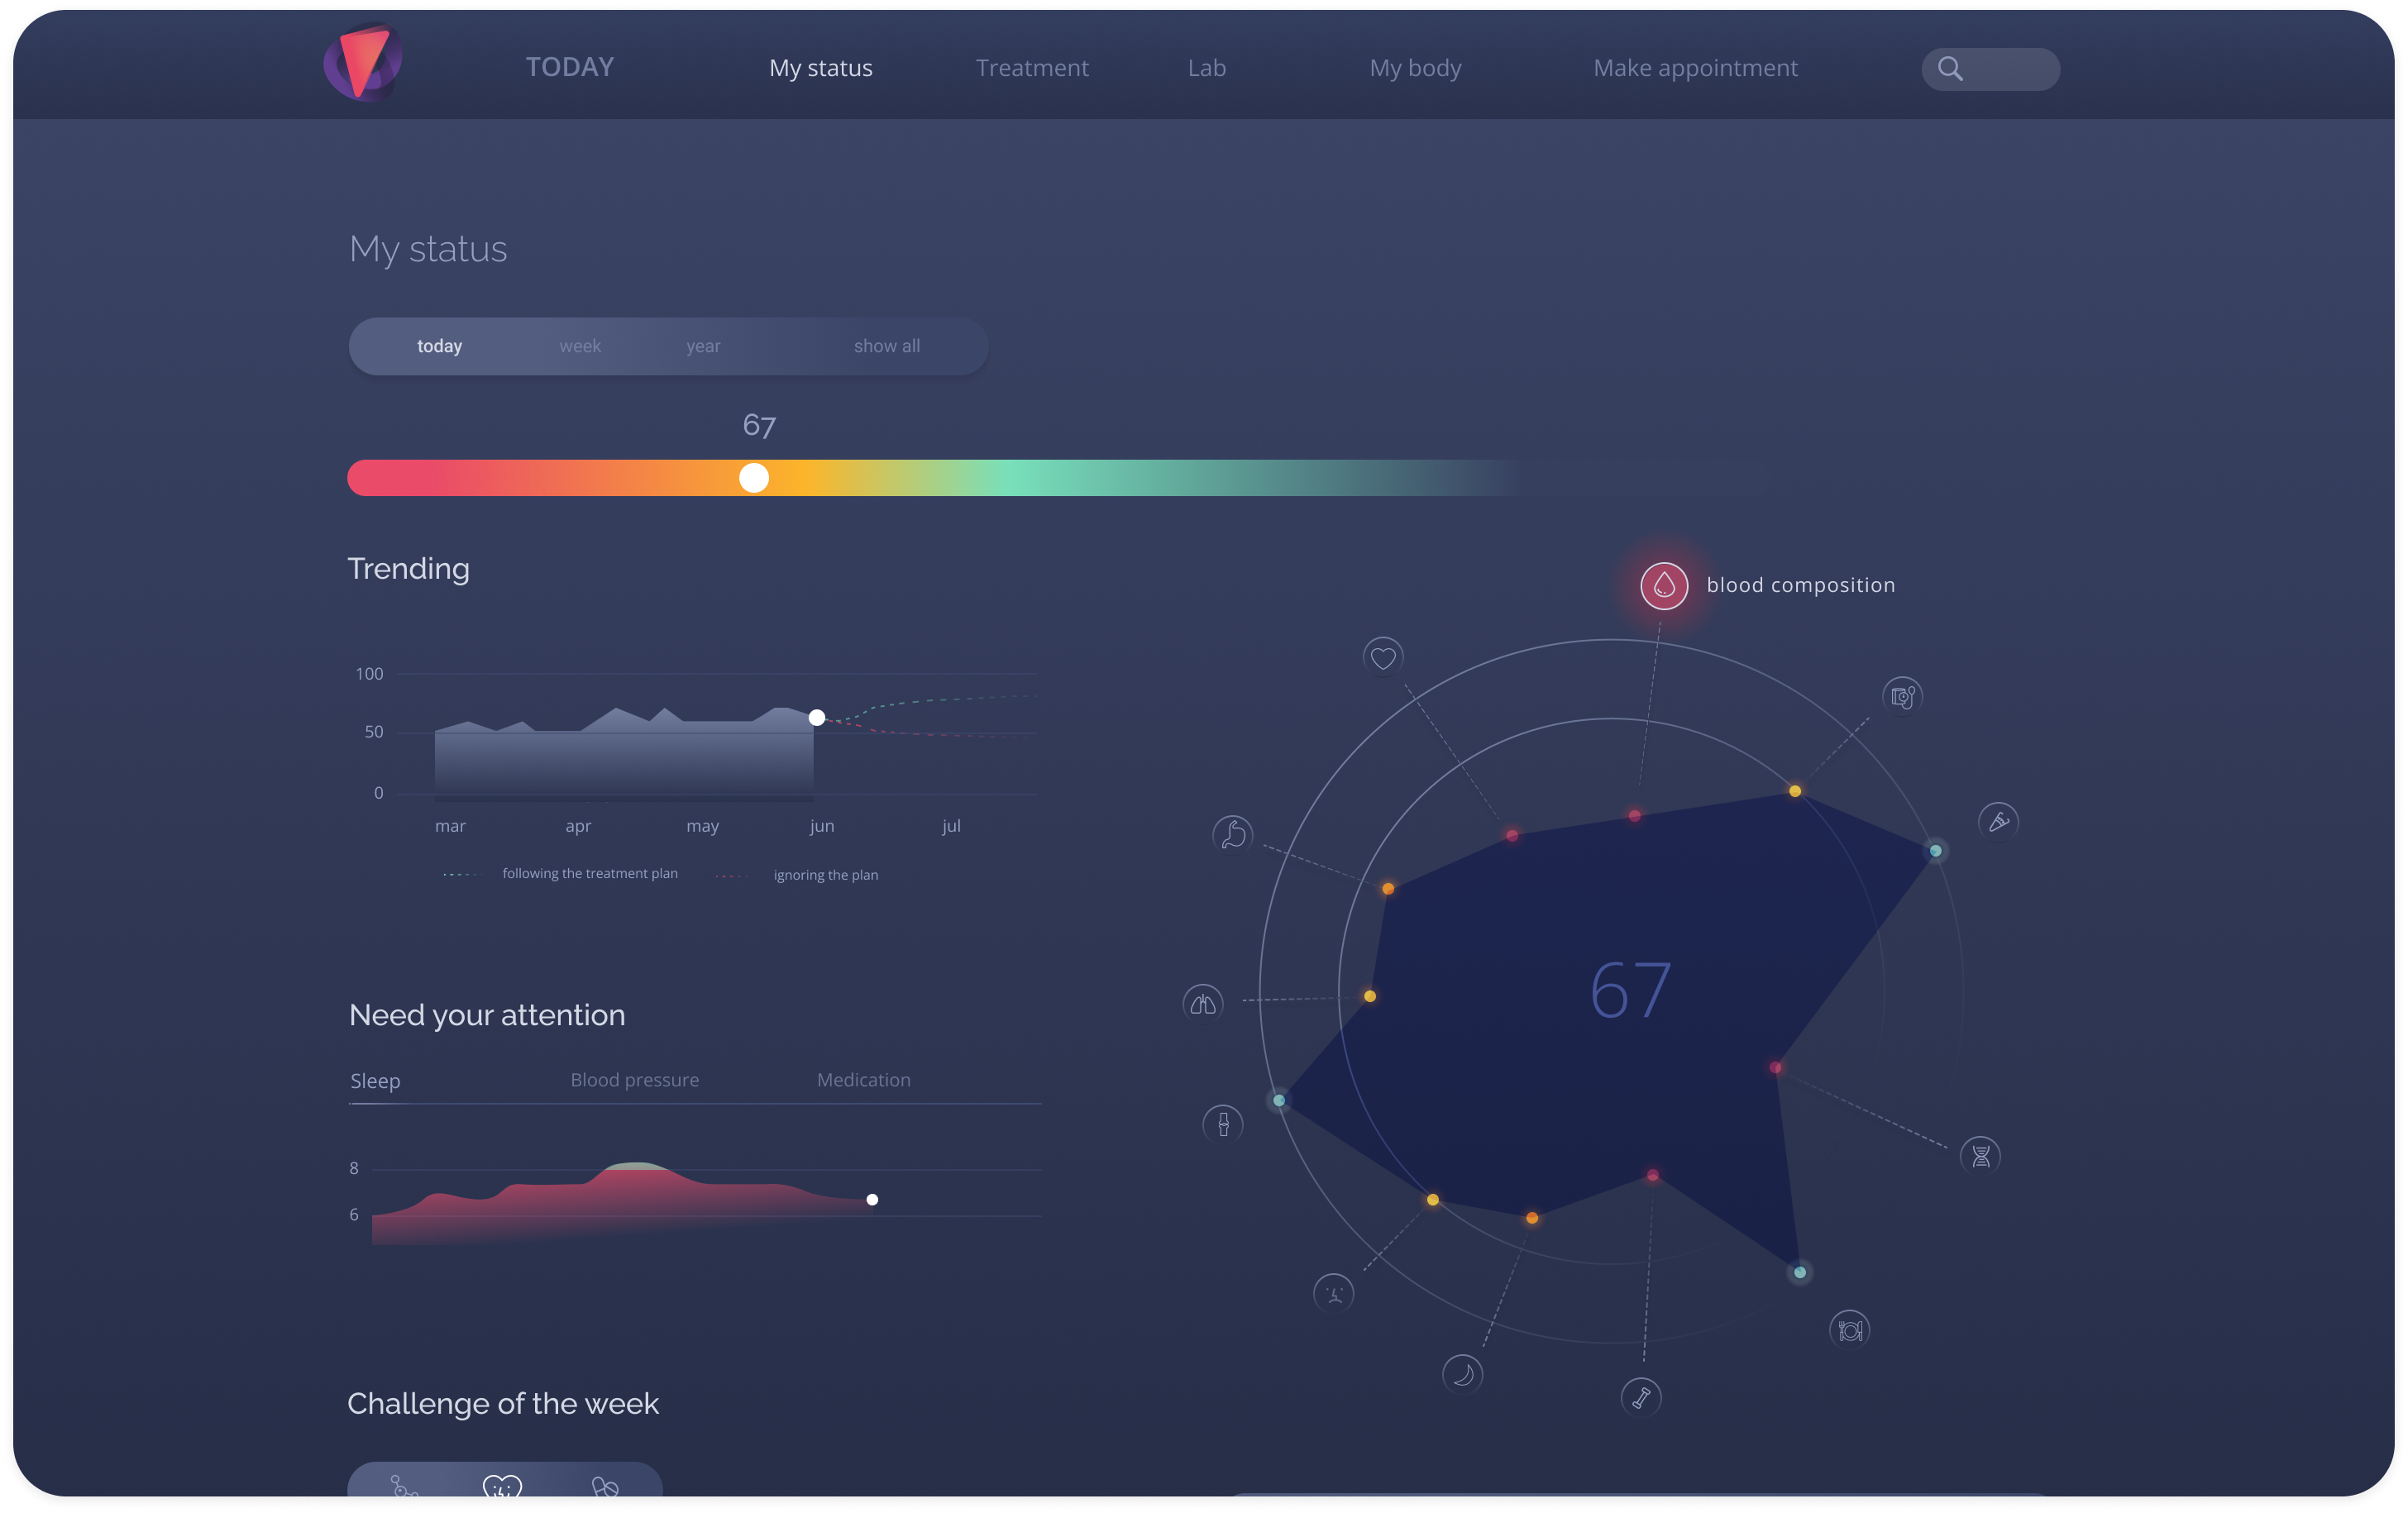
Only 18% of interviewees mentioned prevention and early diagnosis, the smallest number in the research, and the one I treated as an opportunity rather than a reason to drop the idea. Health depends on sleep, nutrition, activity, and heredity, and wearables were already tracking much of it. My status rolls it into one number instead of leaving it scattered across disconnected gadget apps.
One score, broken down by body system
A health score sits on a red-to-green scale, the same gradient used everywhere in the product to mean bad to good. A radar chart shows which body systems are pulling the score down, a Need your attention card surfaces the single worst trend rather than every trend at once, and a weekly challenge turns the plan into small, specific goals instead of a vague instruction to exercise more.
Historical: Treatment history
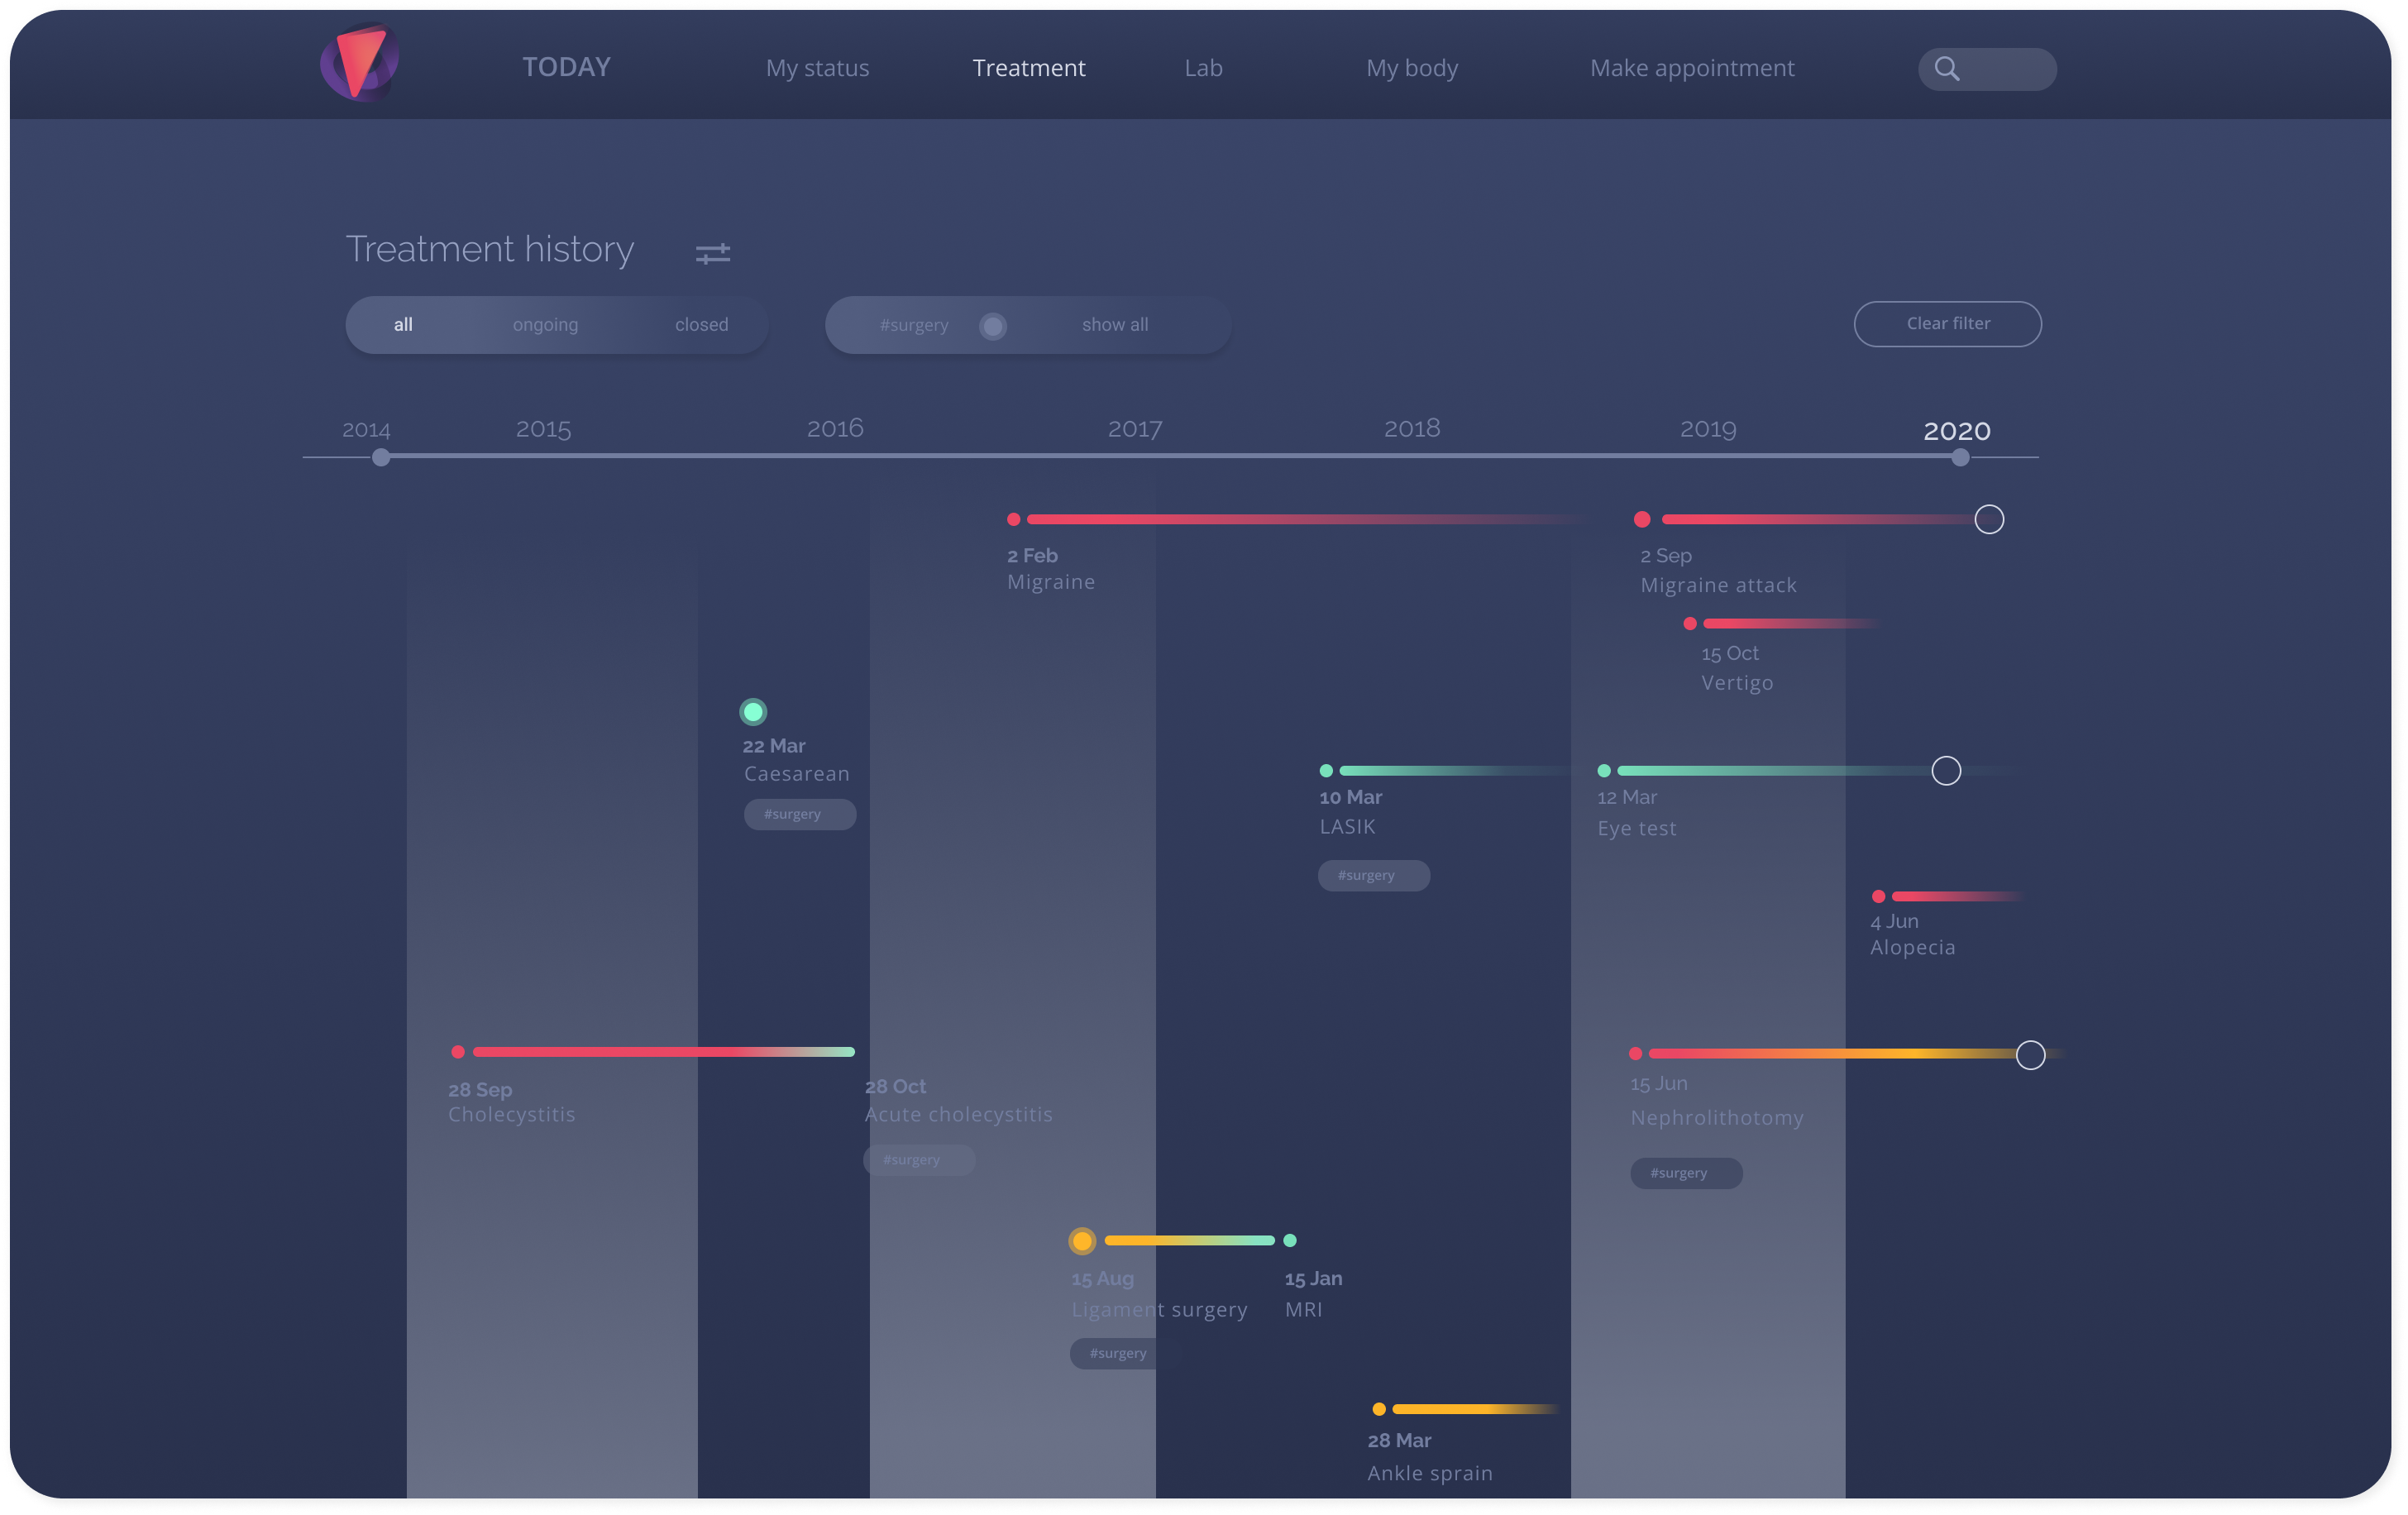
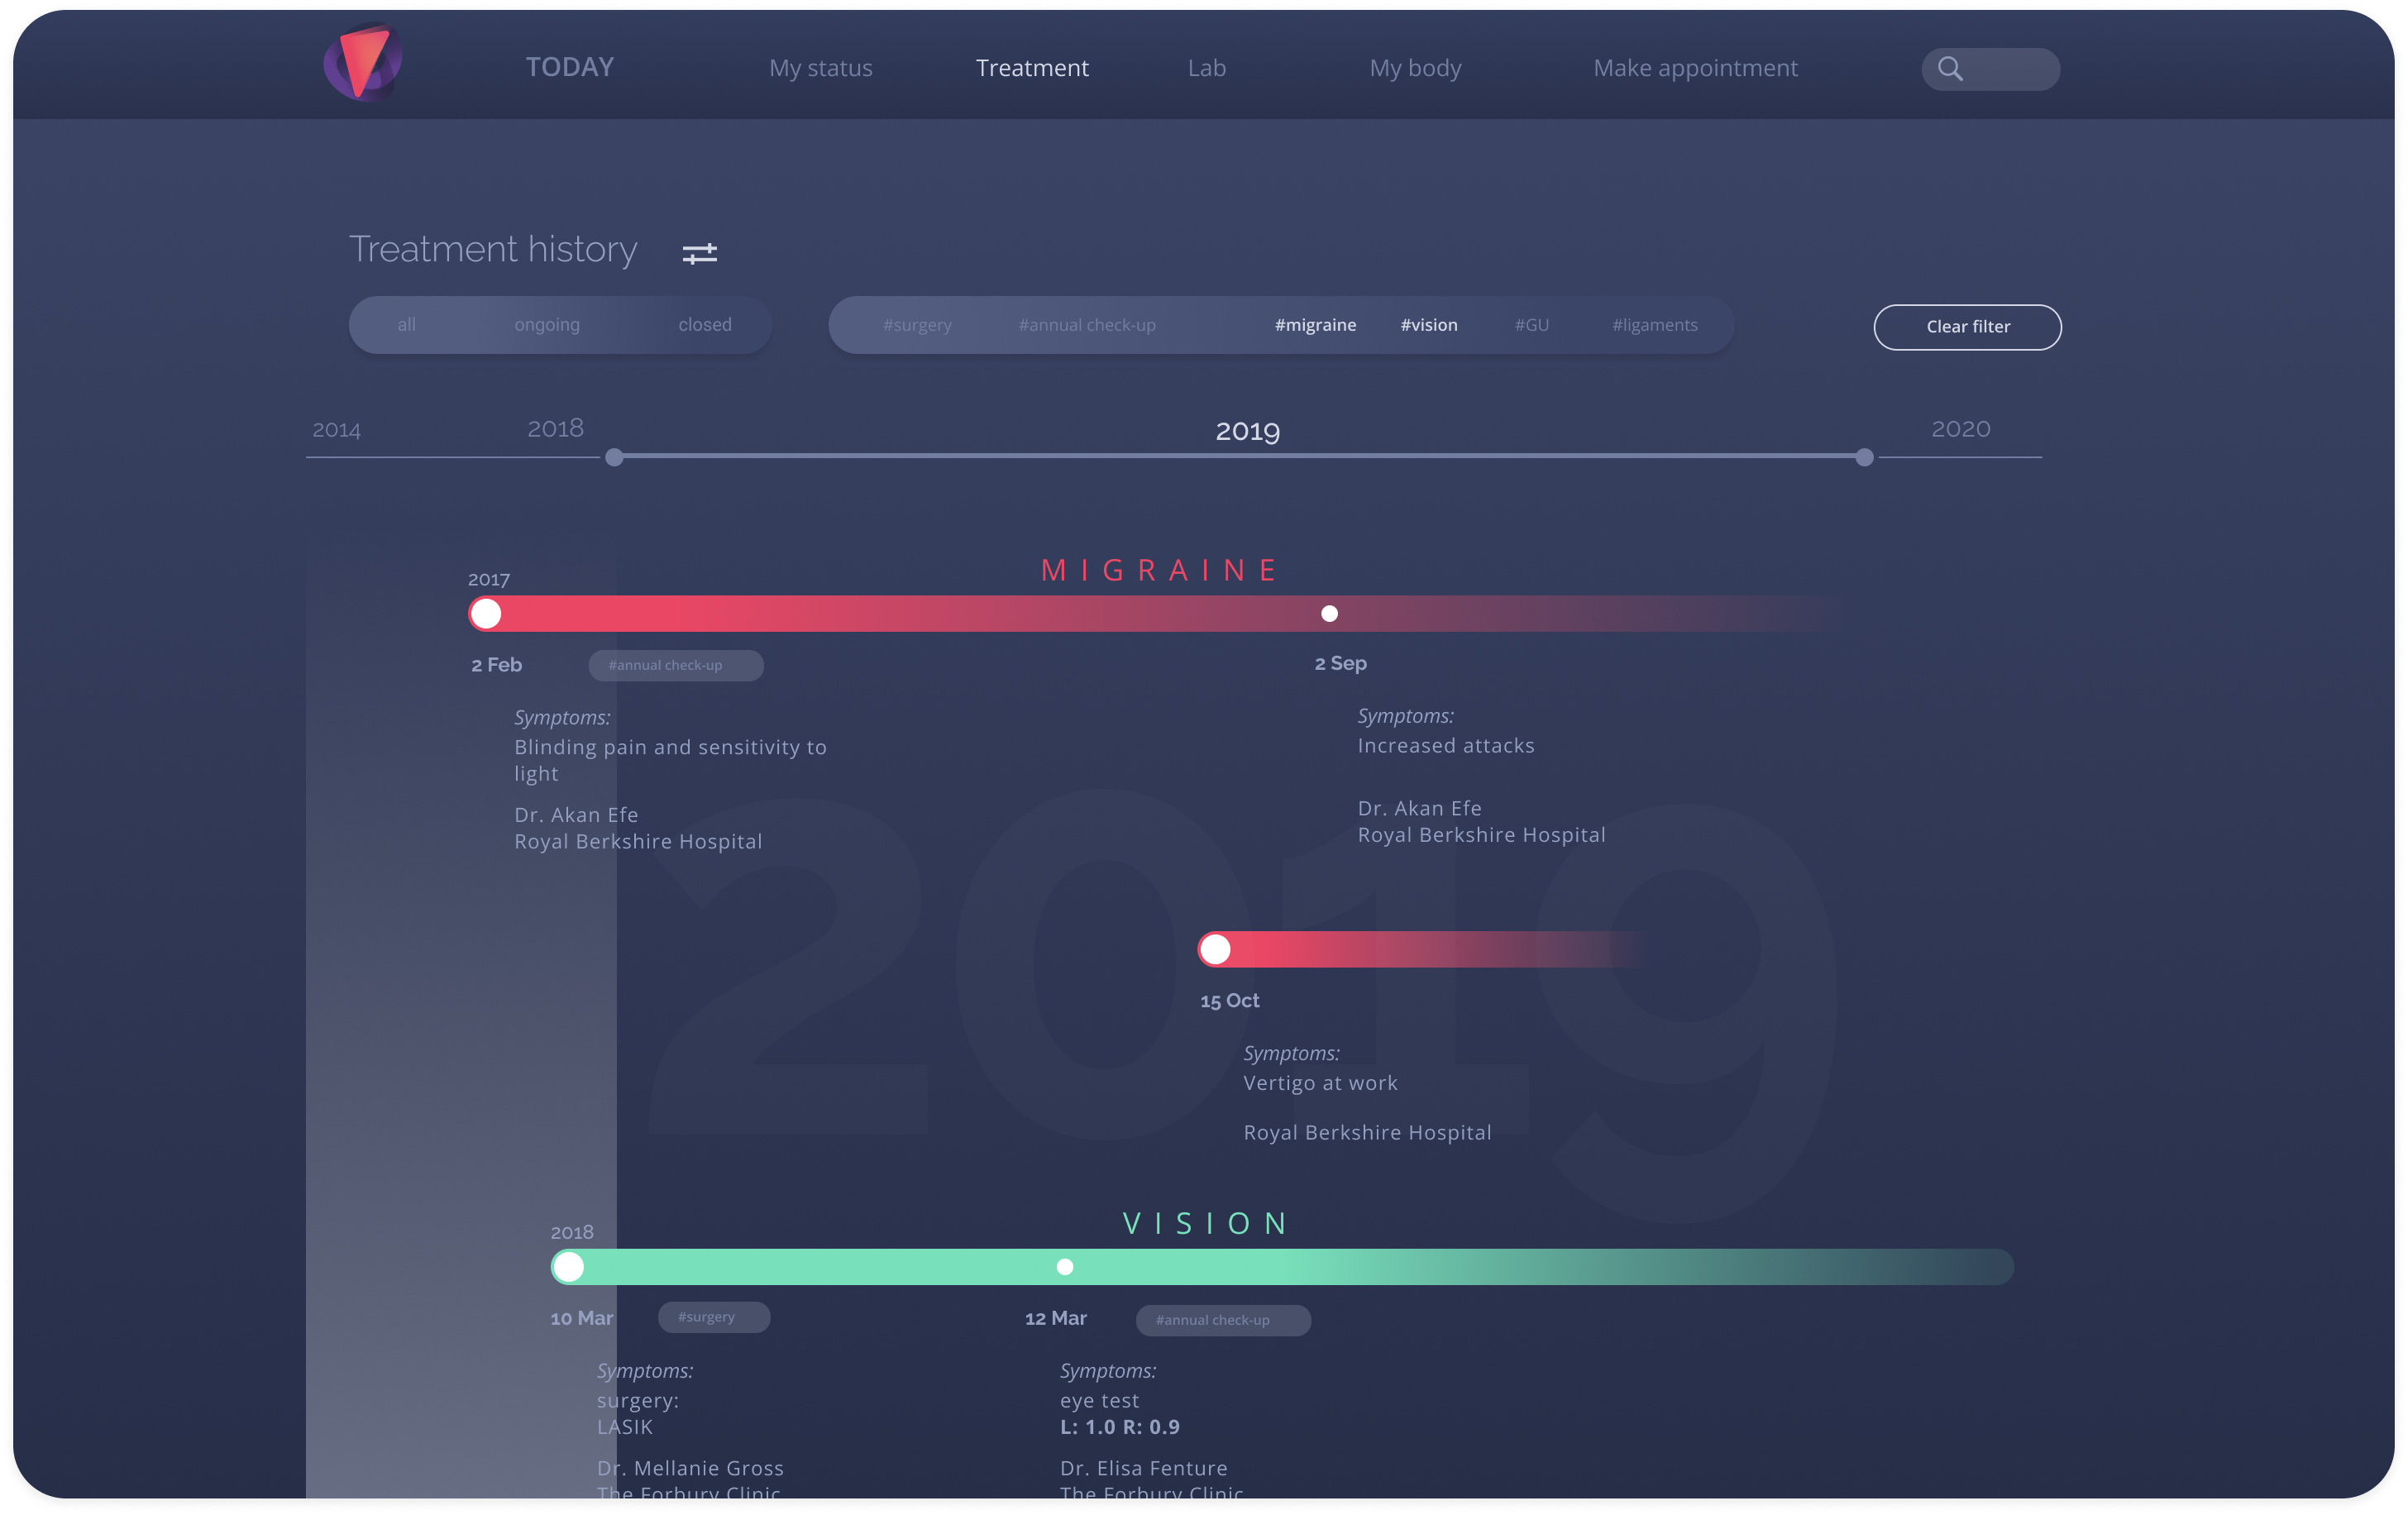
Health history isn't linear: conditions overlap, come back, and get resolved, so a flat list was never going to represent it honestly. Treatment history is the product's answer to the 58% who wanted to know their treatment and vaccination history.
A timeline with three zoom levels
I drew it as a timeline, each condition a bar coloured by its current state, red as the alert colour. Three zoom levels let a patient stop wherever they need: every condition since 2014 at a glance, one year with symptoms, doctor, and clinic for each visit, or one single condition down to diagnosis and prescriptions. The full anamnesis the brief asked for lives at that deepest level, since most people never re-read a ten-year-old anamnesis, but doctors do.
Clear: Lab results
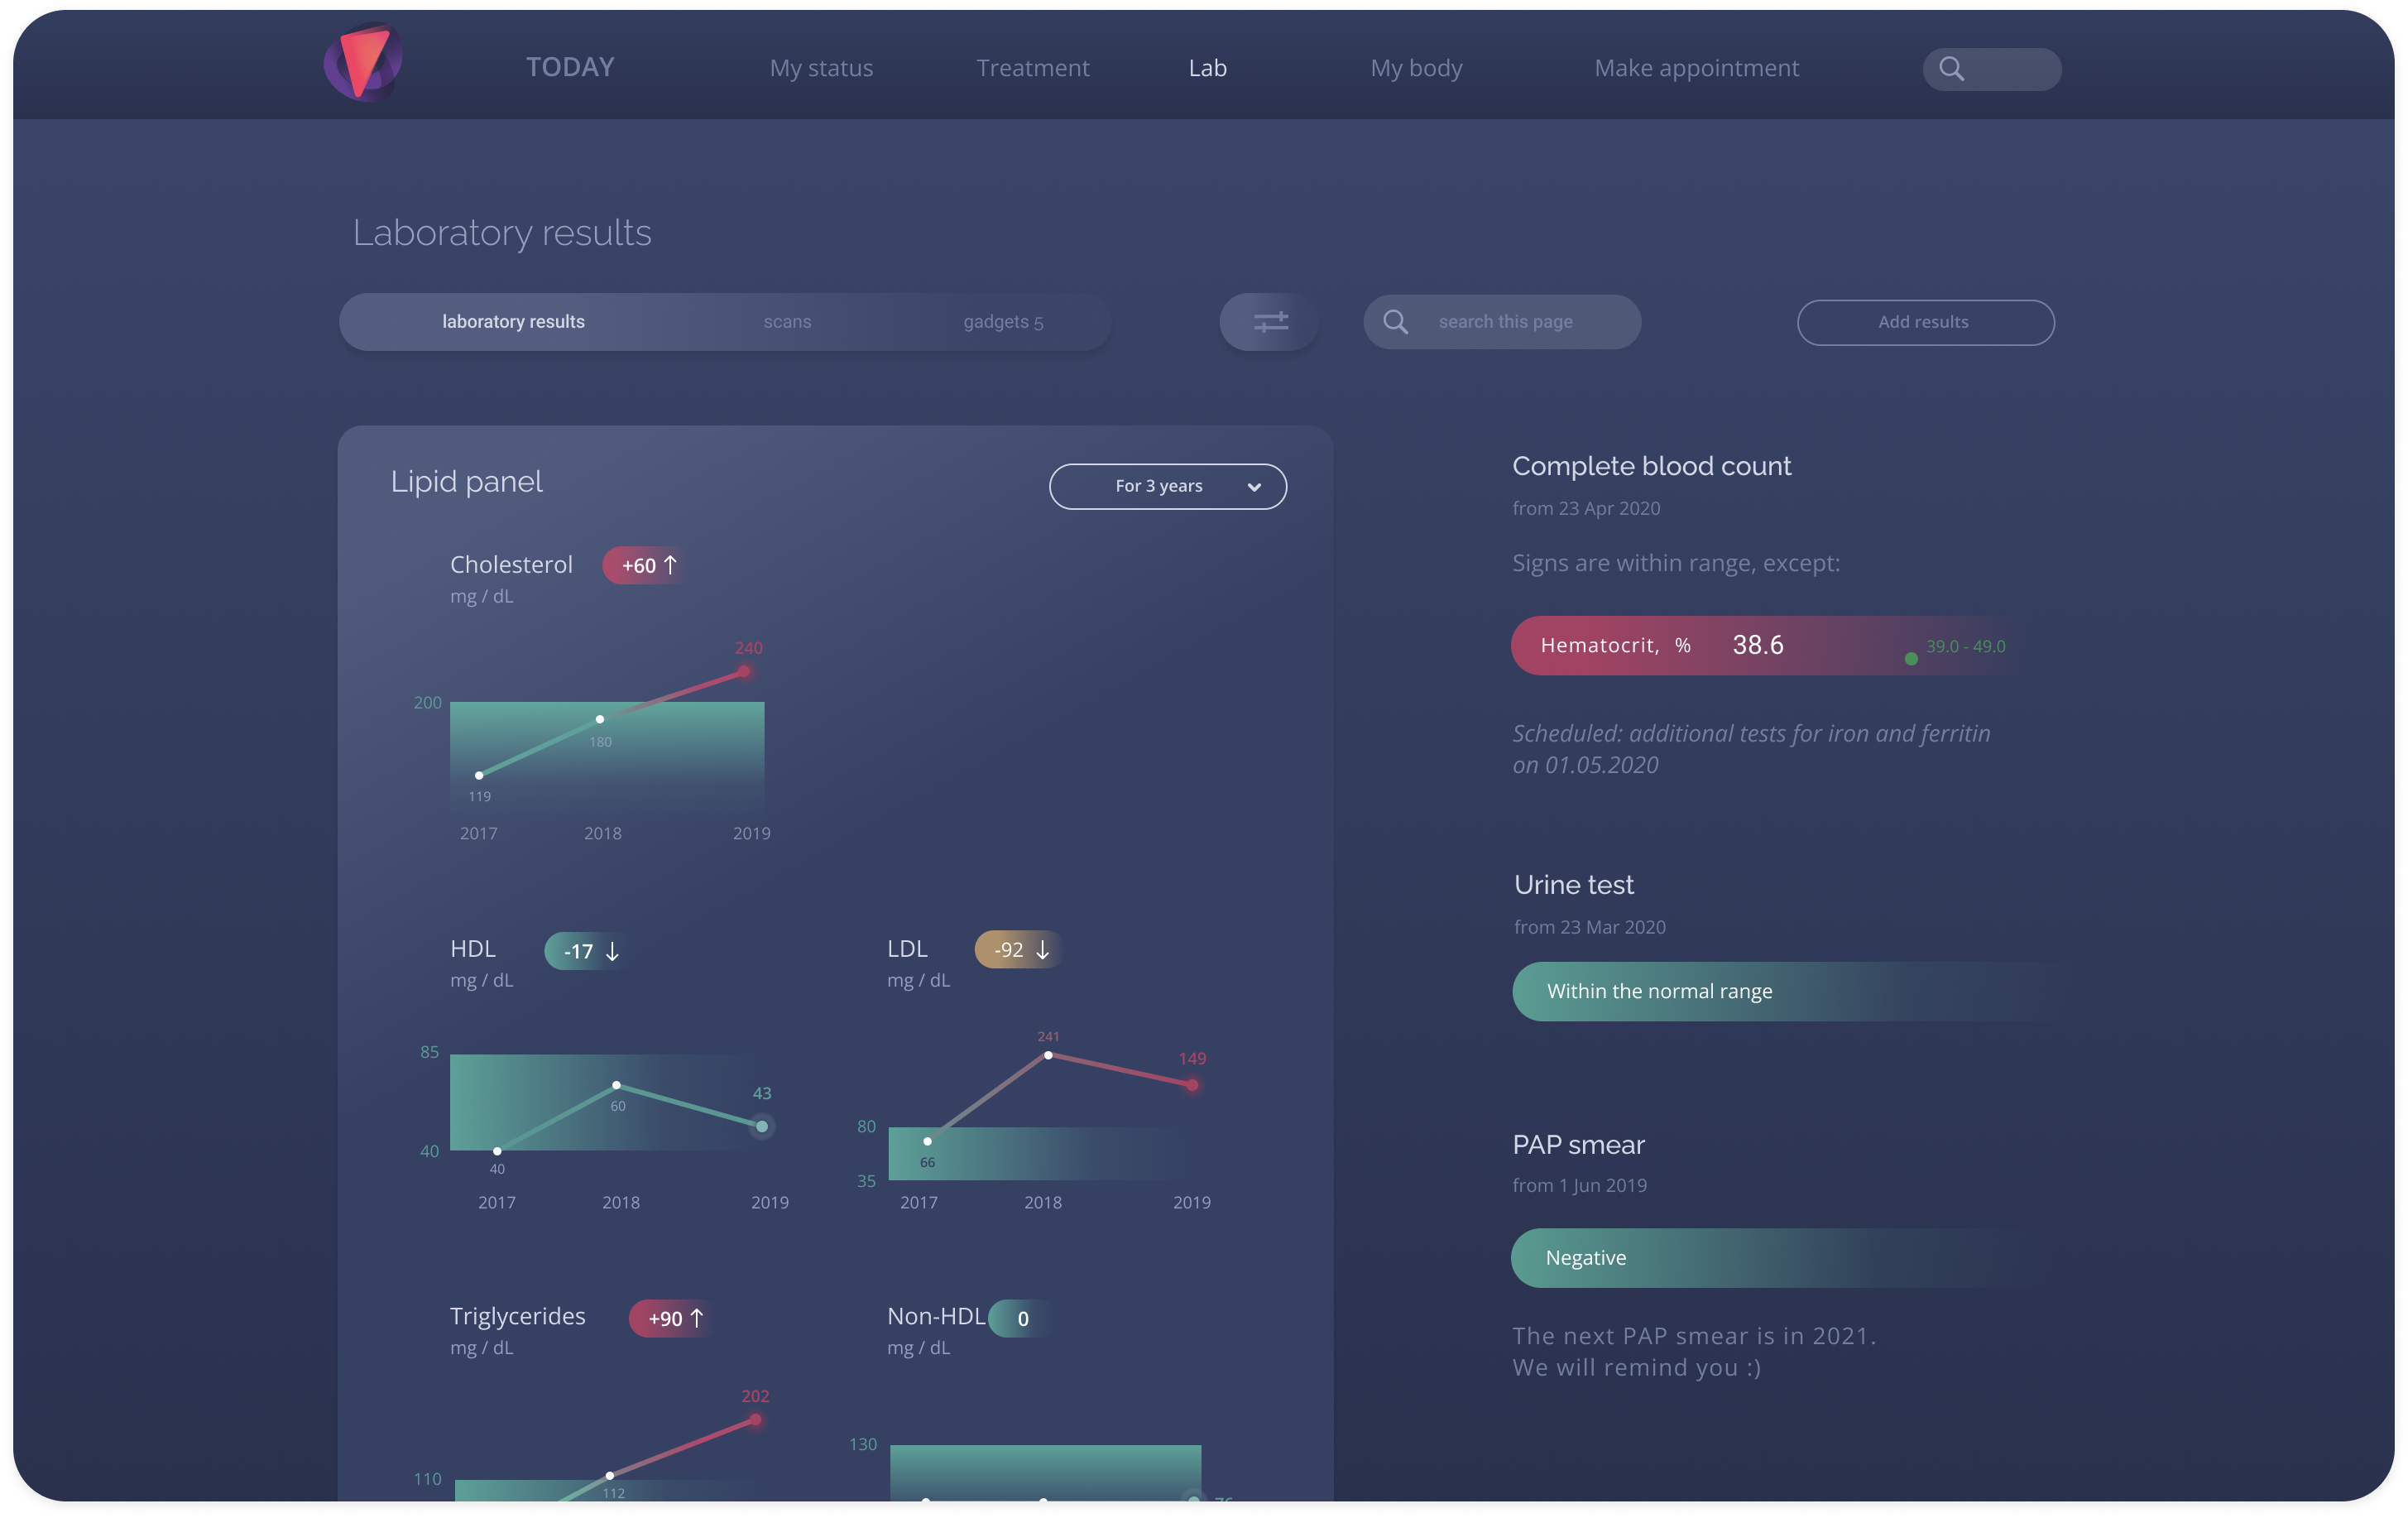
The brief's raw lab tables were exactly what the research said patients couldn't use. Lab results rebuilds that screen around the study's single largest finding: 81% wanted their results without a clinic visit.
Only the outliers, with the trend behind them
Instead of full tables, each panel opens with a line reading Signs are within range, except, and lists only the values outside normal, with the change since the last test. Normal results collapse into a single green line instead of repeating twenty rows that say nothing new. Opening a panel shows that value's three-year trend against its normal band, so a result reads as a direction, not just a number.
Educational: My body
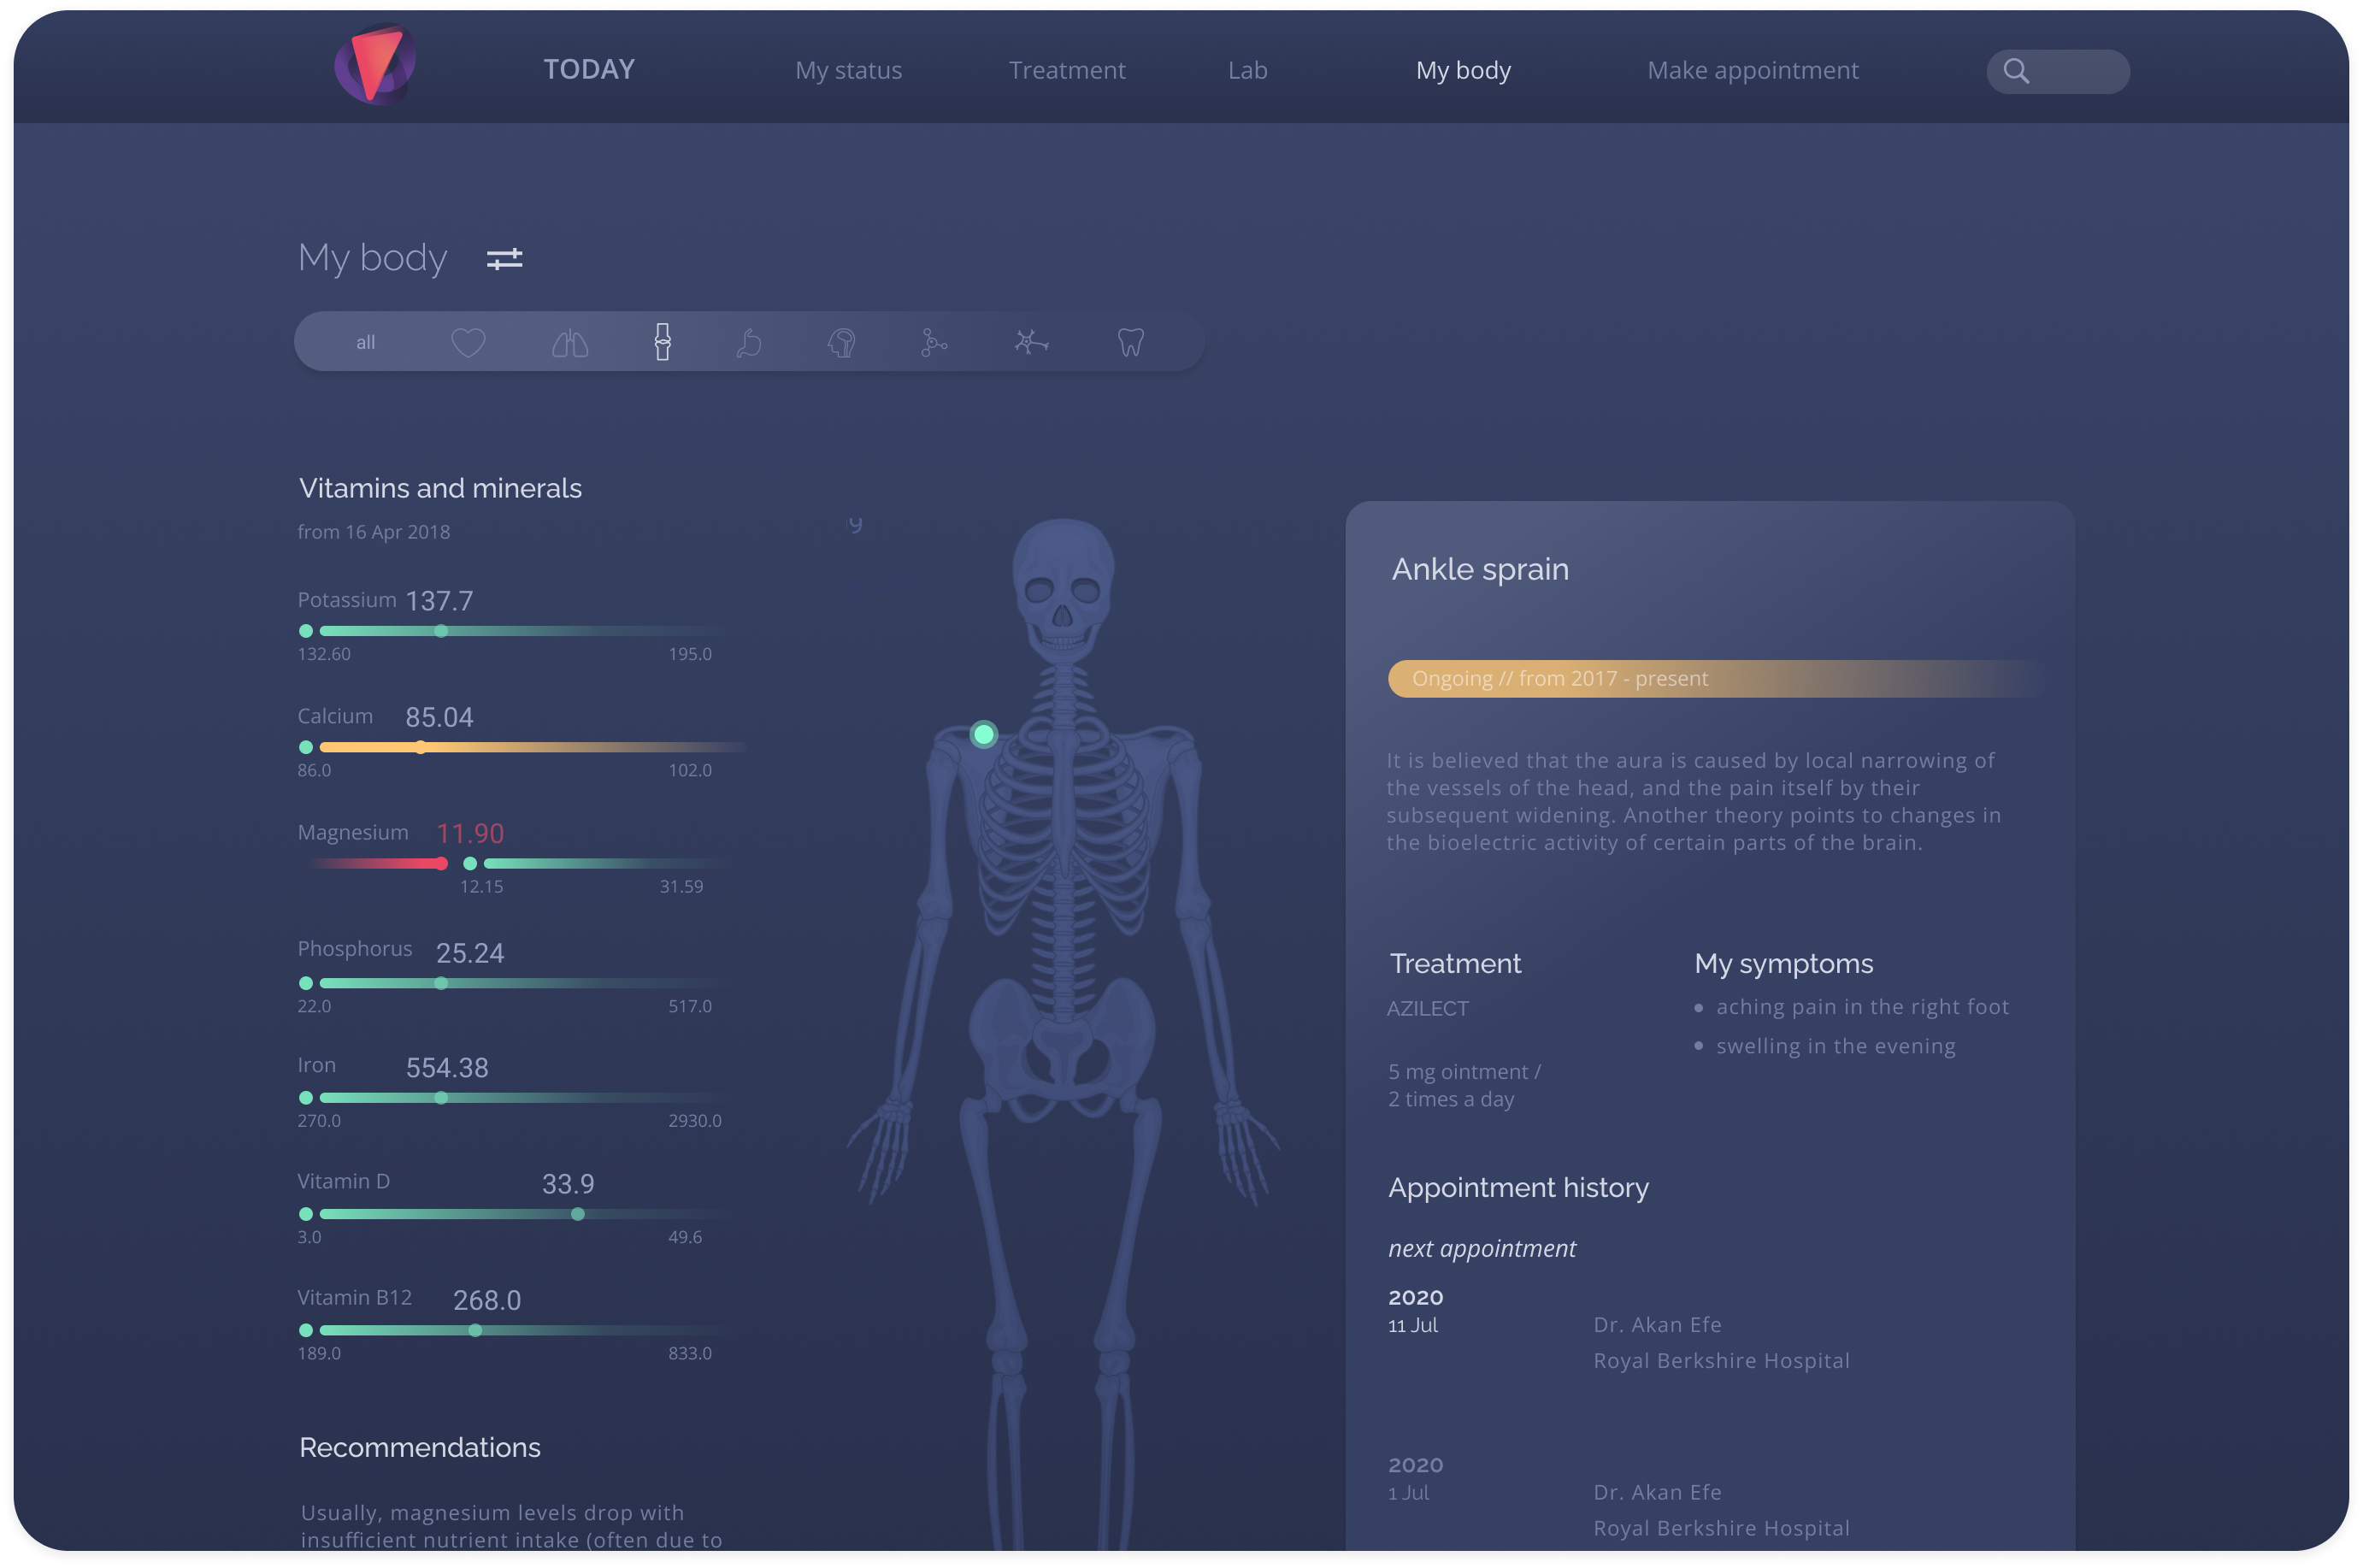
A patient who understands what a result means is less likely to chase a test they don't need, which is close to what 73% of interviewees said they wanted: fewer unnecessary tests and appointments.
Data mapped onto the body, not a glossary
Every piece of data groups by the part of the body it belongs to. A low magnesium result appears on a skeleton next to a plain-language explanation and a concrete suggestion, High Mg foods, instead of a Latin term and a reference range. Markers can also flag risks linked to age, heredity, or lifestyle, so the screen teaches rather than just reports.
The Doctor's View
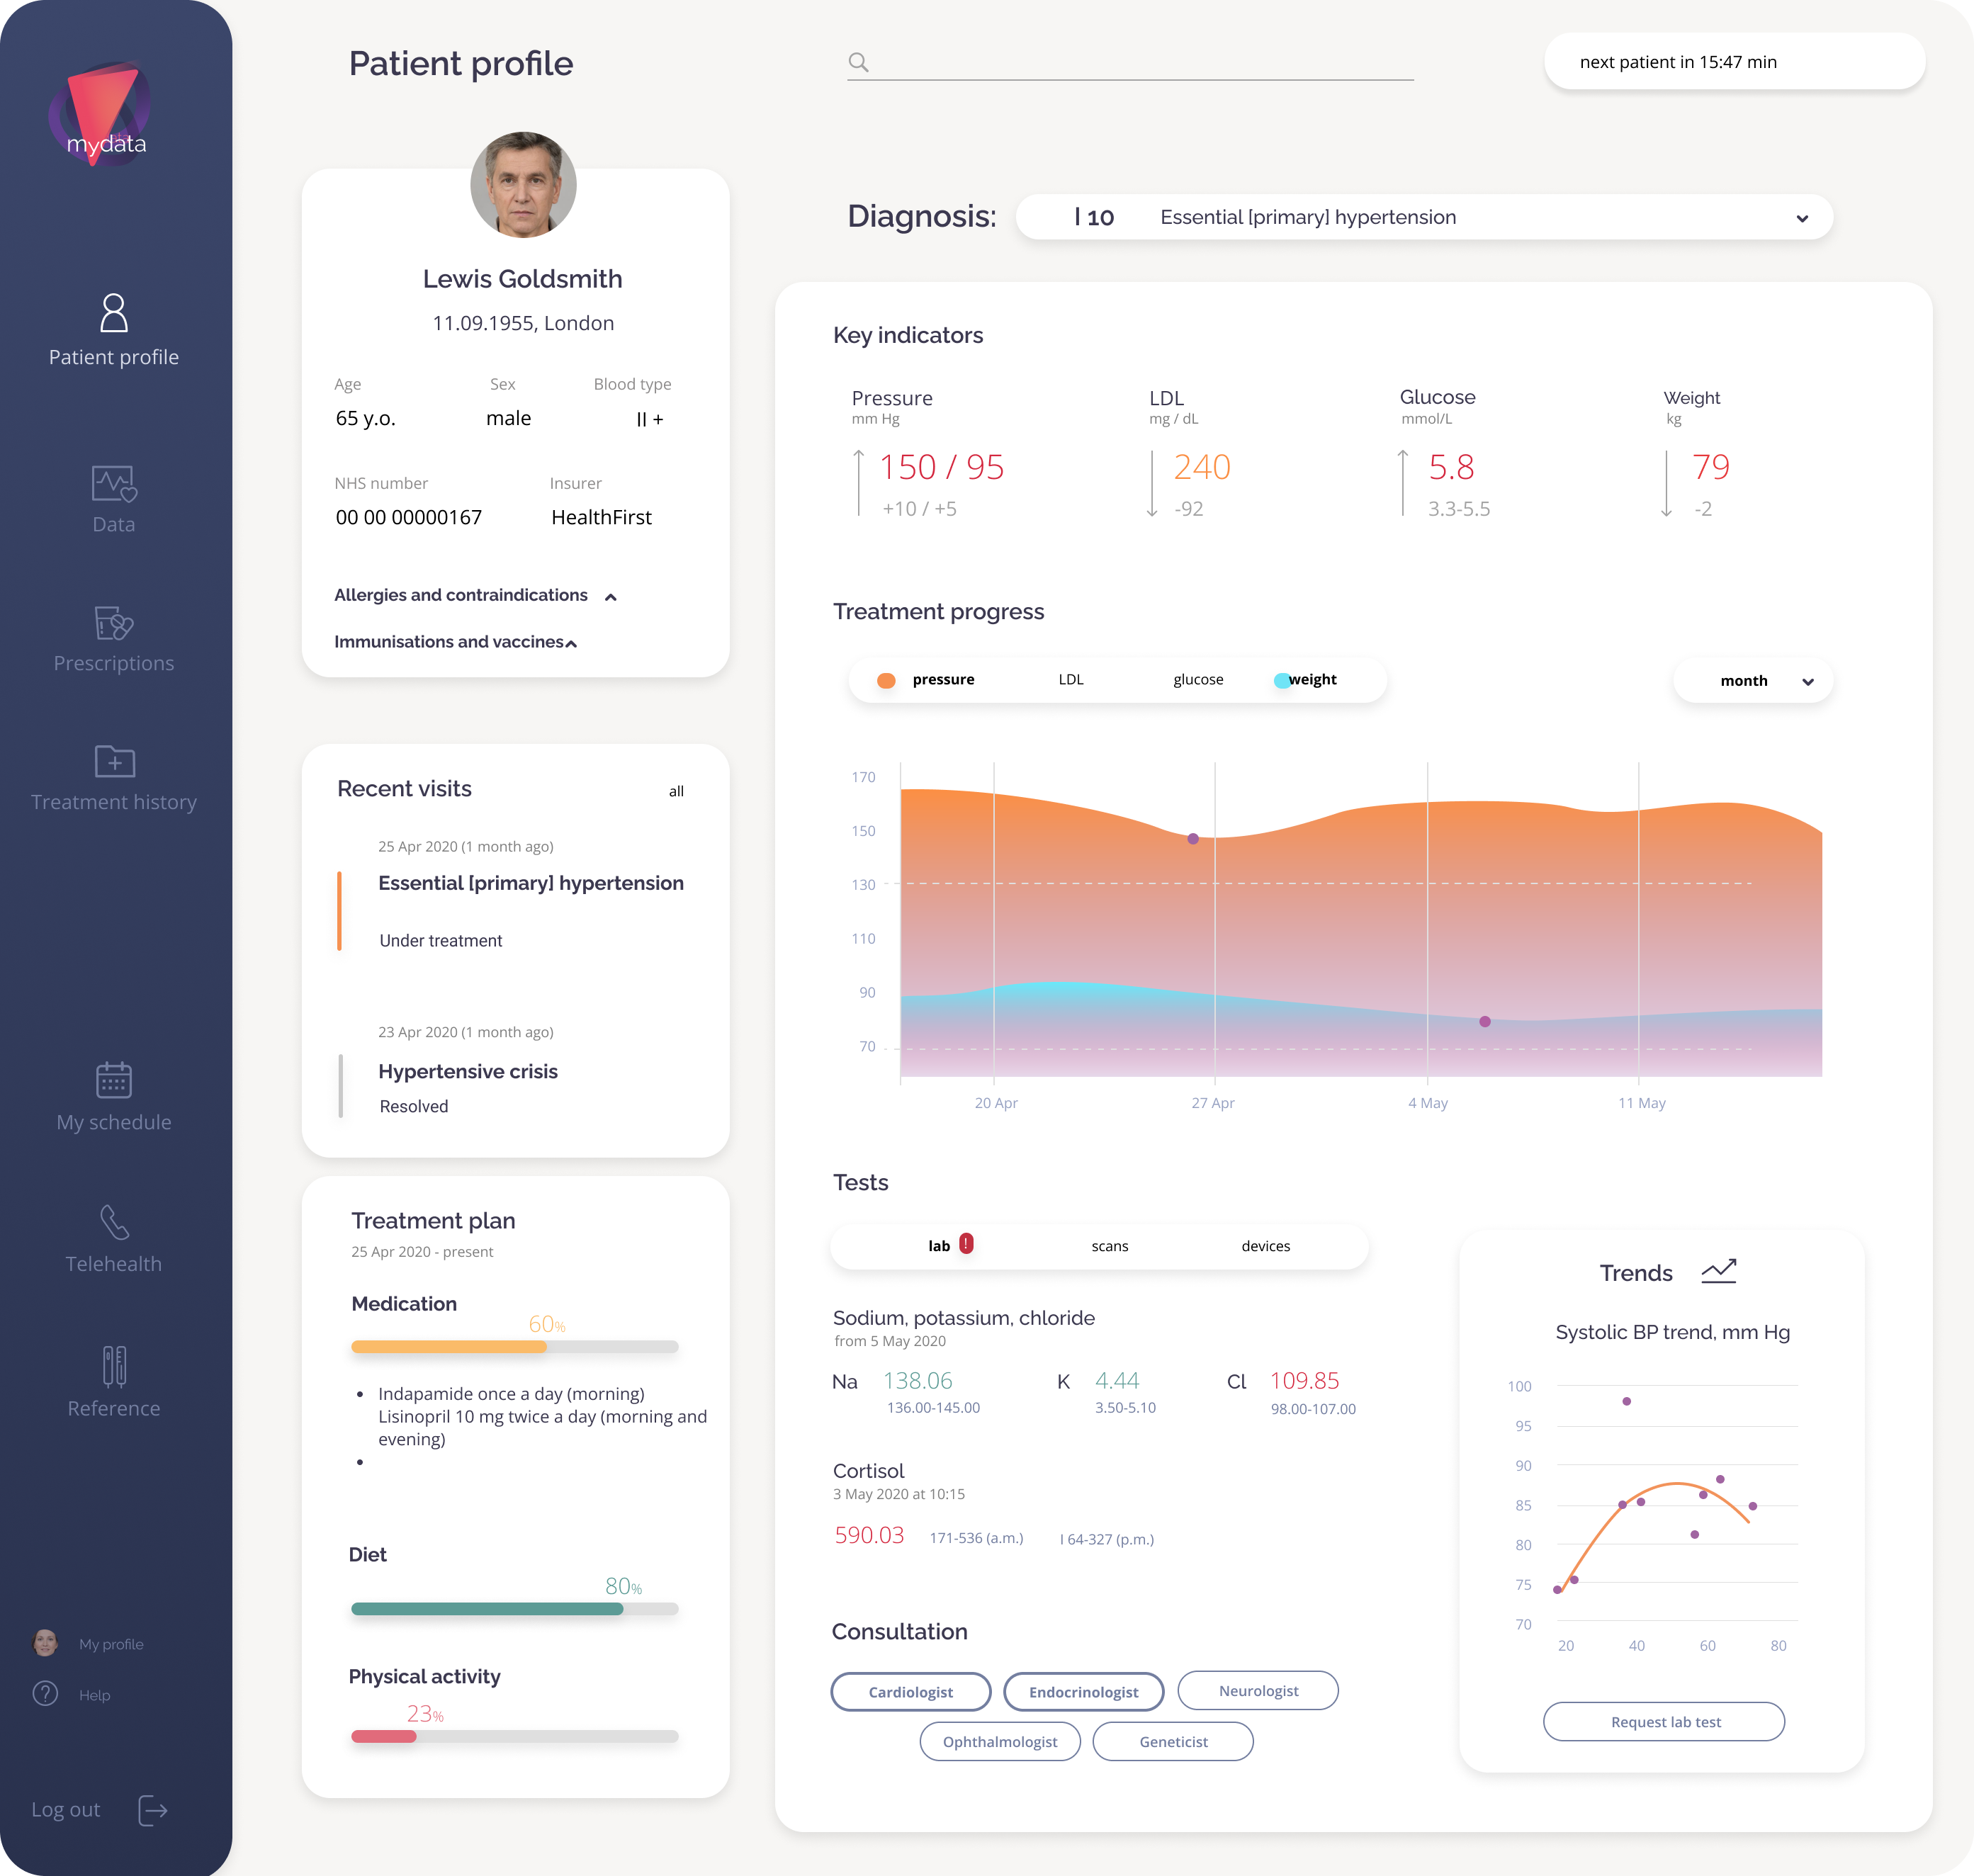
The same record, built for a one-minute scan instead of an evening read. Doctors were in the original interviews, but this side only got three days in stage two, built from scratch after the patient side was already set.
Diagnosis first, dense by design
The doctor sees the patient's full profile and anamnesis: treatment history, symptoms, every lab test and appointment. From here they prescribe and adjust treatment, and the changes flow straight back to the patient's Today page. Following the client's brief, the screen leads with the diagnosis, key indicators against their targets, how treatment is moving them, and allergies. It uses a lighter, denser layout than the patient side, since clinicians scan many records a day and a calm evening read would only slow them down.
Outcome and Reflection
My Data placed first at the Digital Health Hackathon in Moscow. The concept won on the strength of the research behind it: a generic health dashboard became a record built around what 20 interviews actually said patients needed, not what a medical record template assumes they need. The style stayed consistent across both stages, a dark navy base for the patient side and a lighter, denser version of the same grid and type for the doctor, with one warm-to-cool gradient that means bad to good everywhere it appears, so neither side ever needed its own visual language.
Even in a field full of ready-made solutions, talking to users can show you a different way to solve their problem. The interviews turned a generic health dashboard into a record that patients can read.

Looking Back From 2026
The concept won, but it was never tested with real users. Revisiting it now, three things stand out as what I'd do differently.
- Test the health score with people. A single number like 67 is powerful but risky: it can scare people or reassure them falsely, and that's not something to ship on instinct alone.
- Design mobile first. The brief asked for web and mobile, in light and dark themes. I scoped it to desktop to finish in time, but patients check results on their phones, not at a desk.
- Bring clinicians in earlier. Doctors were in the interviews, but the doctor side got only three days. What doctors are willing to enter is what decides what patients can actually see.
Role & Responsibilities
Solo: research, flows, wireframes, UI, and style guide across a two-stage hackathon brief